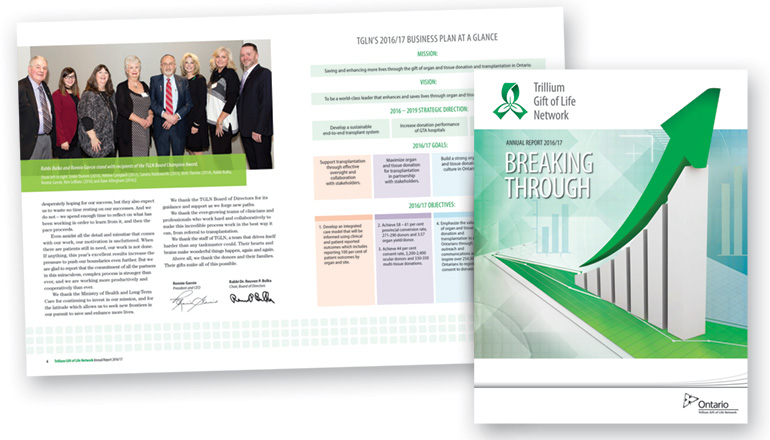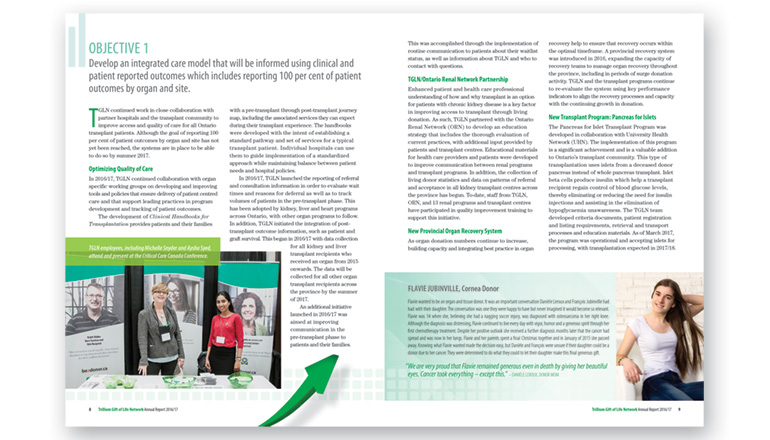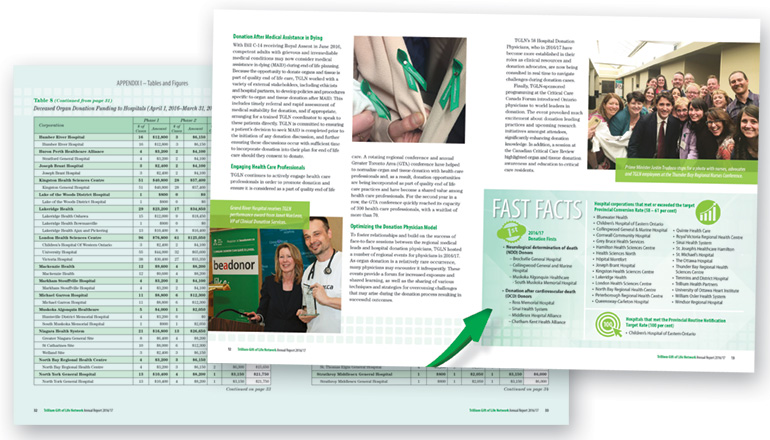
For the 2016-2017 annual report theme of ‘Breaking Through’ we wanted to visually capture the idea of attaining and exceeding measurable goals. We have used a montage of bar graphs, line graphs, and grids – elements that are a visual presentation of data statistics. A bold green arrow highlights this year’s success by rising and breaking through the bar graph border.
The annual report was made into both English and French as well as accessible PDFs for users of assistive devices.


